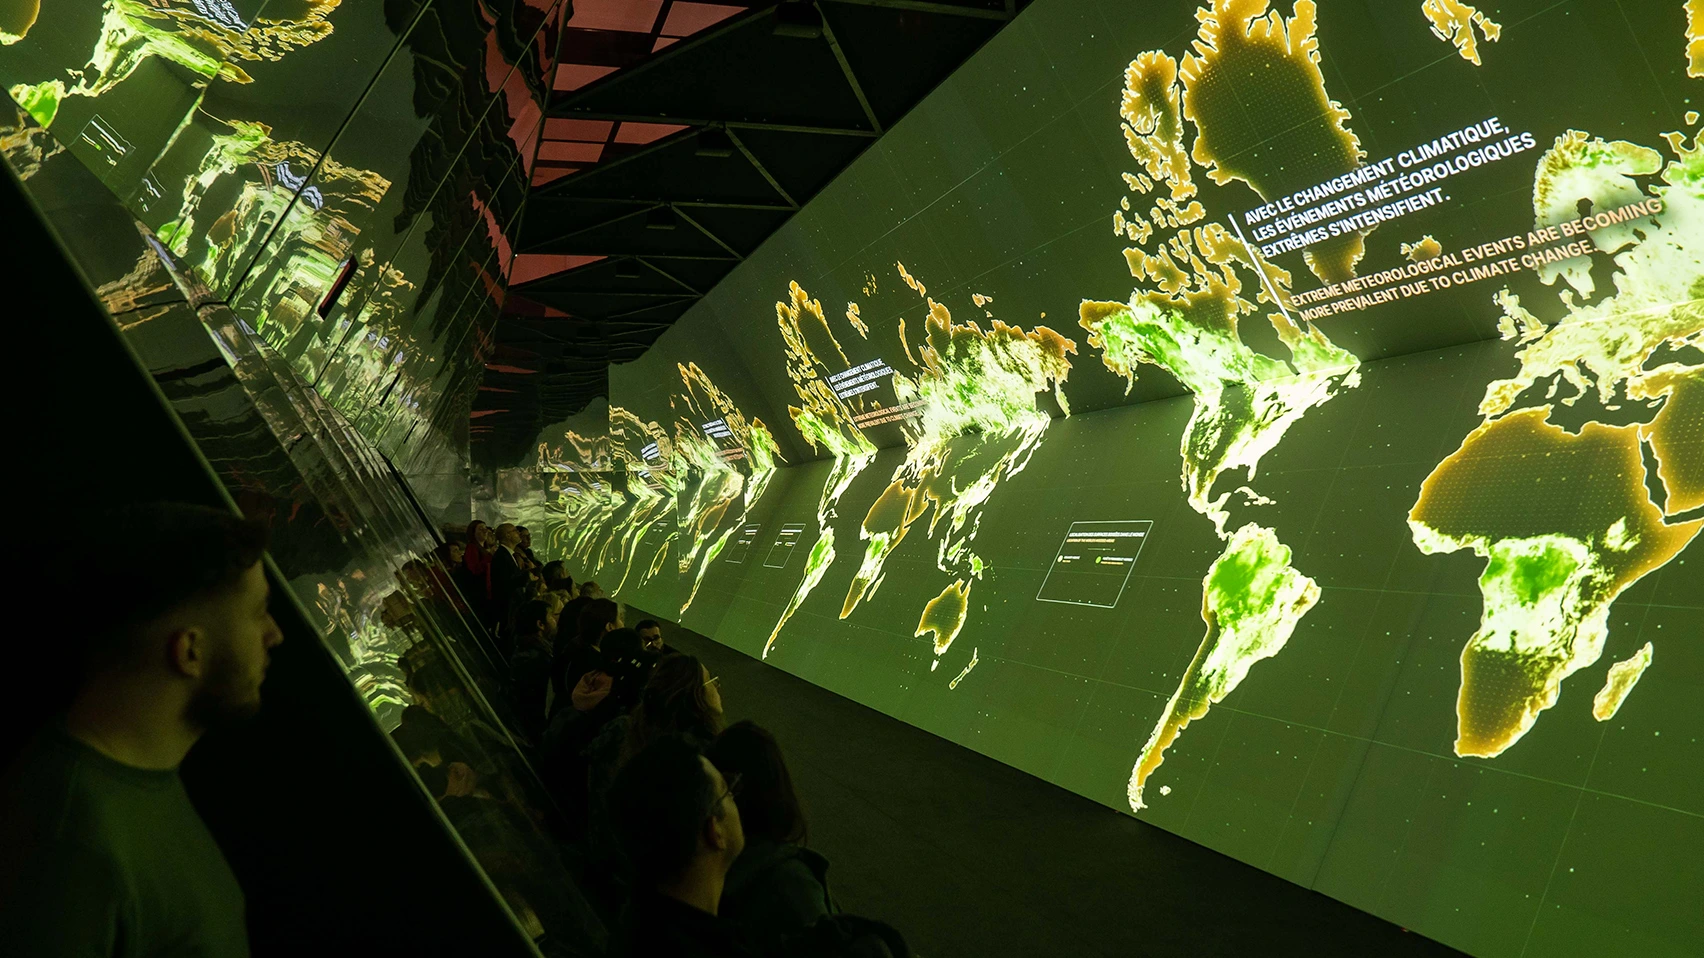
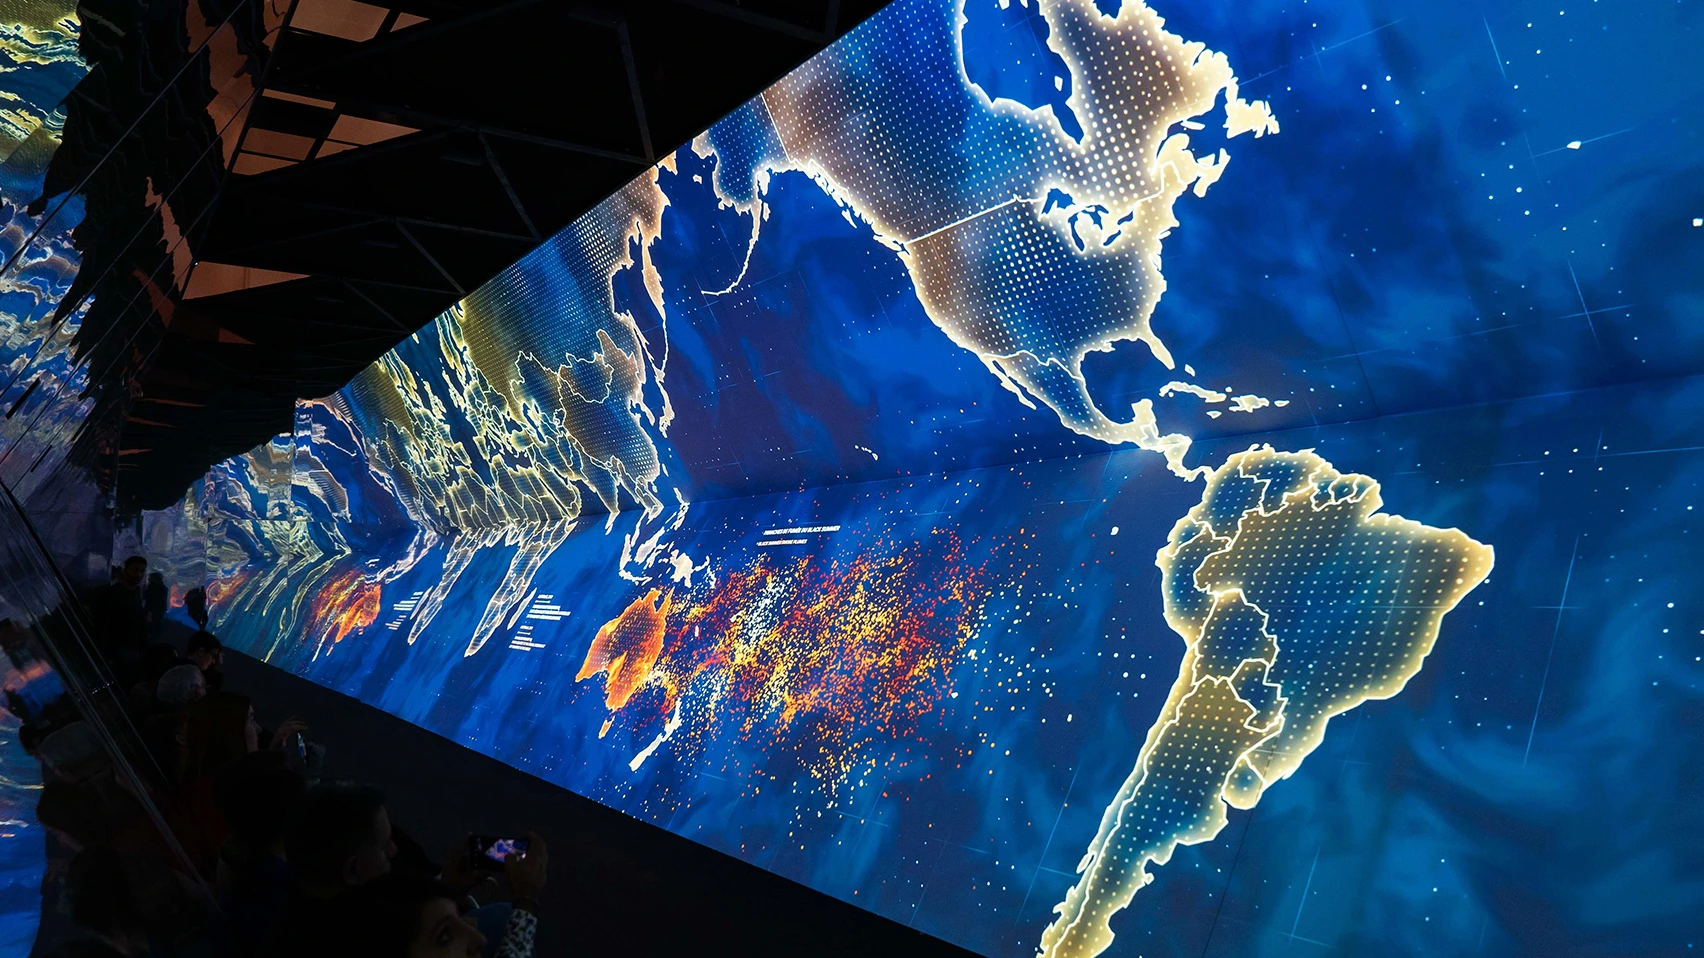
megafires
A 15-minute experience inside a tunnel to discover megafires and their impact.
Agency — Holymage
Role — Art direction • Design • 2D & 3D Animation
Client — Quai des Savoirs
I worked on the immersive experience for the exhibition Feux, Mégafeux at Quai des Savoirs in Toulouse, France.
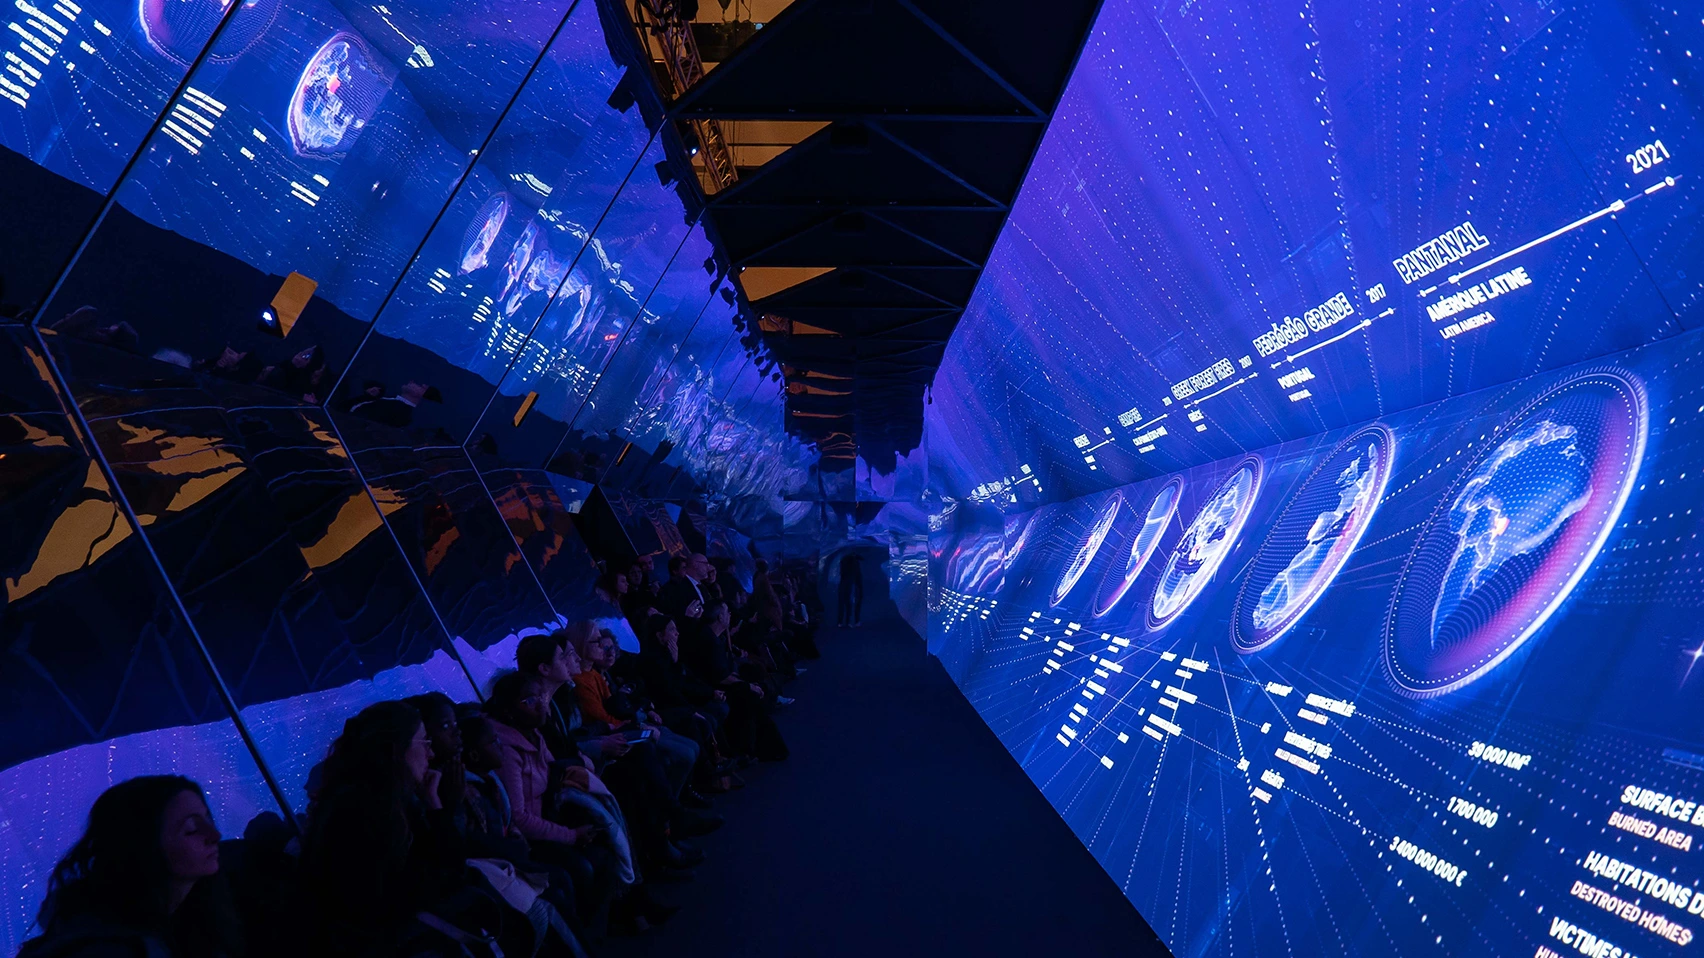
Inside a 17-metre-long tunnel, visitors embark on a 15-minute journey exploring wildfires, from their causes and consequences to the ways they can be prevented and managed.
I worked closely with the creative director on the art direction, helping shape the storytelling and visual direction of the experience. I also contributed to the design and animation of several sequences.
As a Toulouse native, this project held special meaning for me.
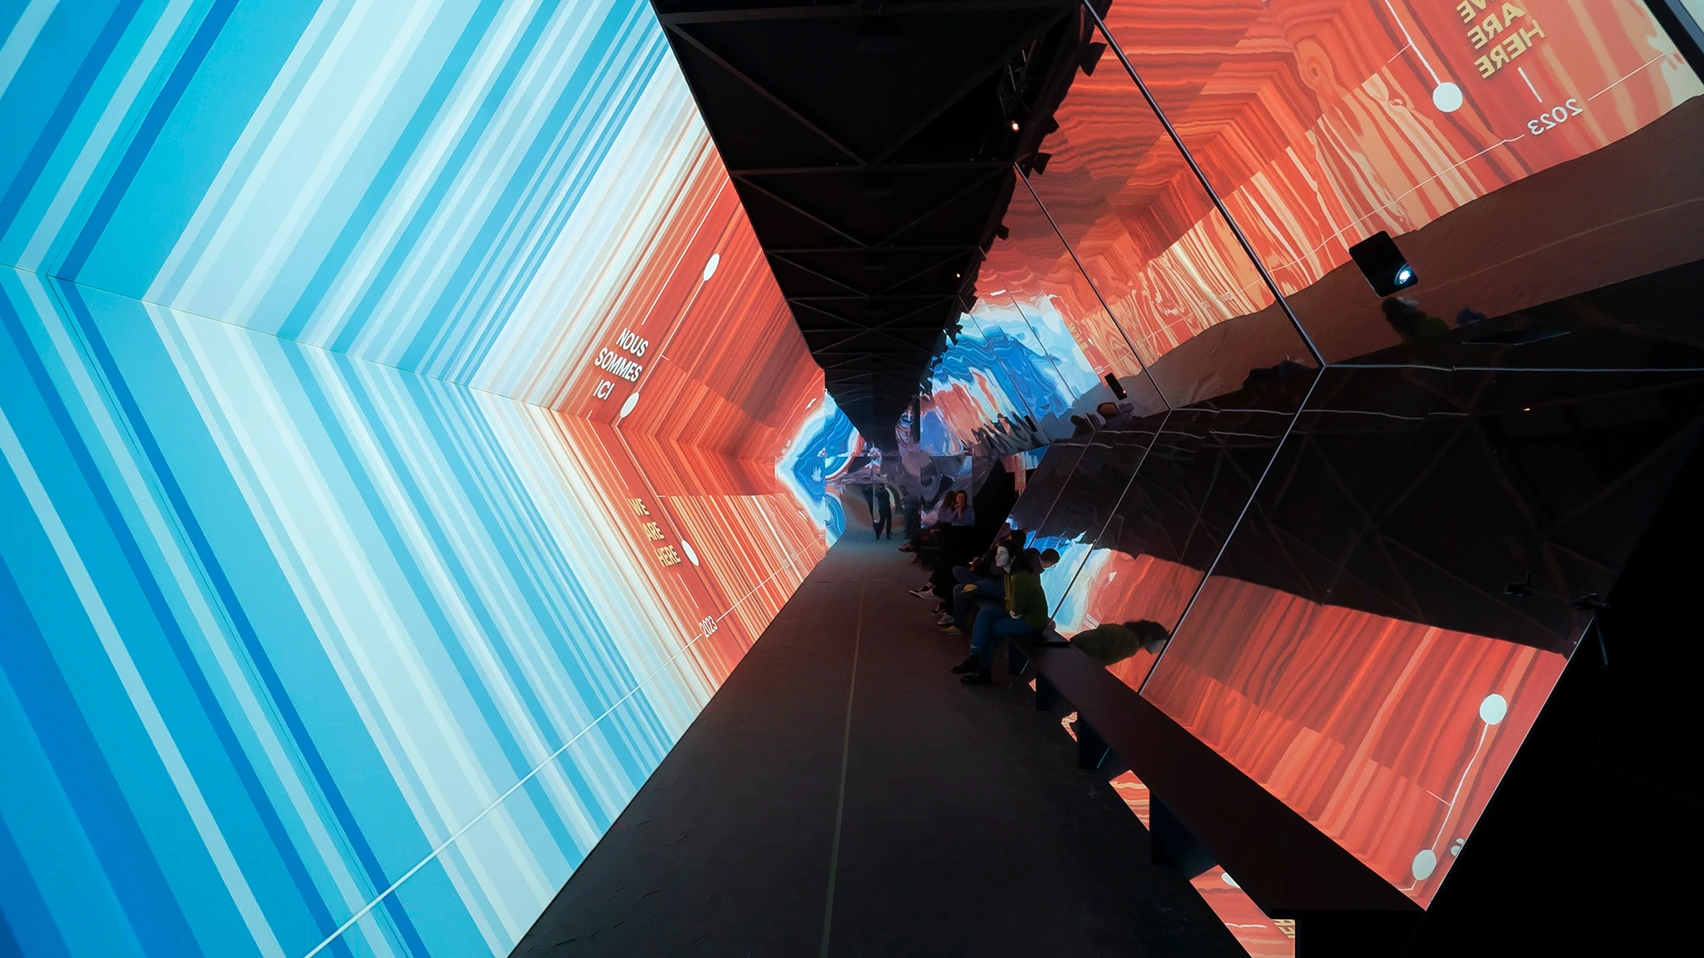
data visualization
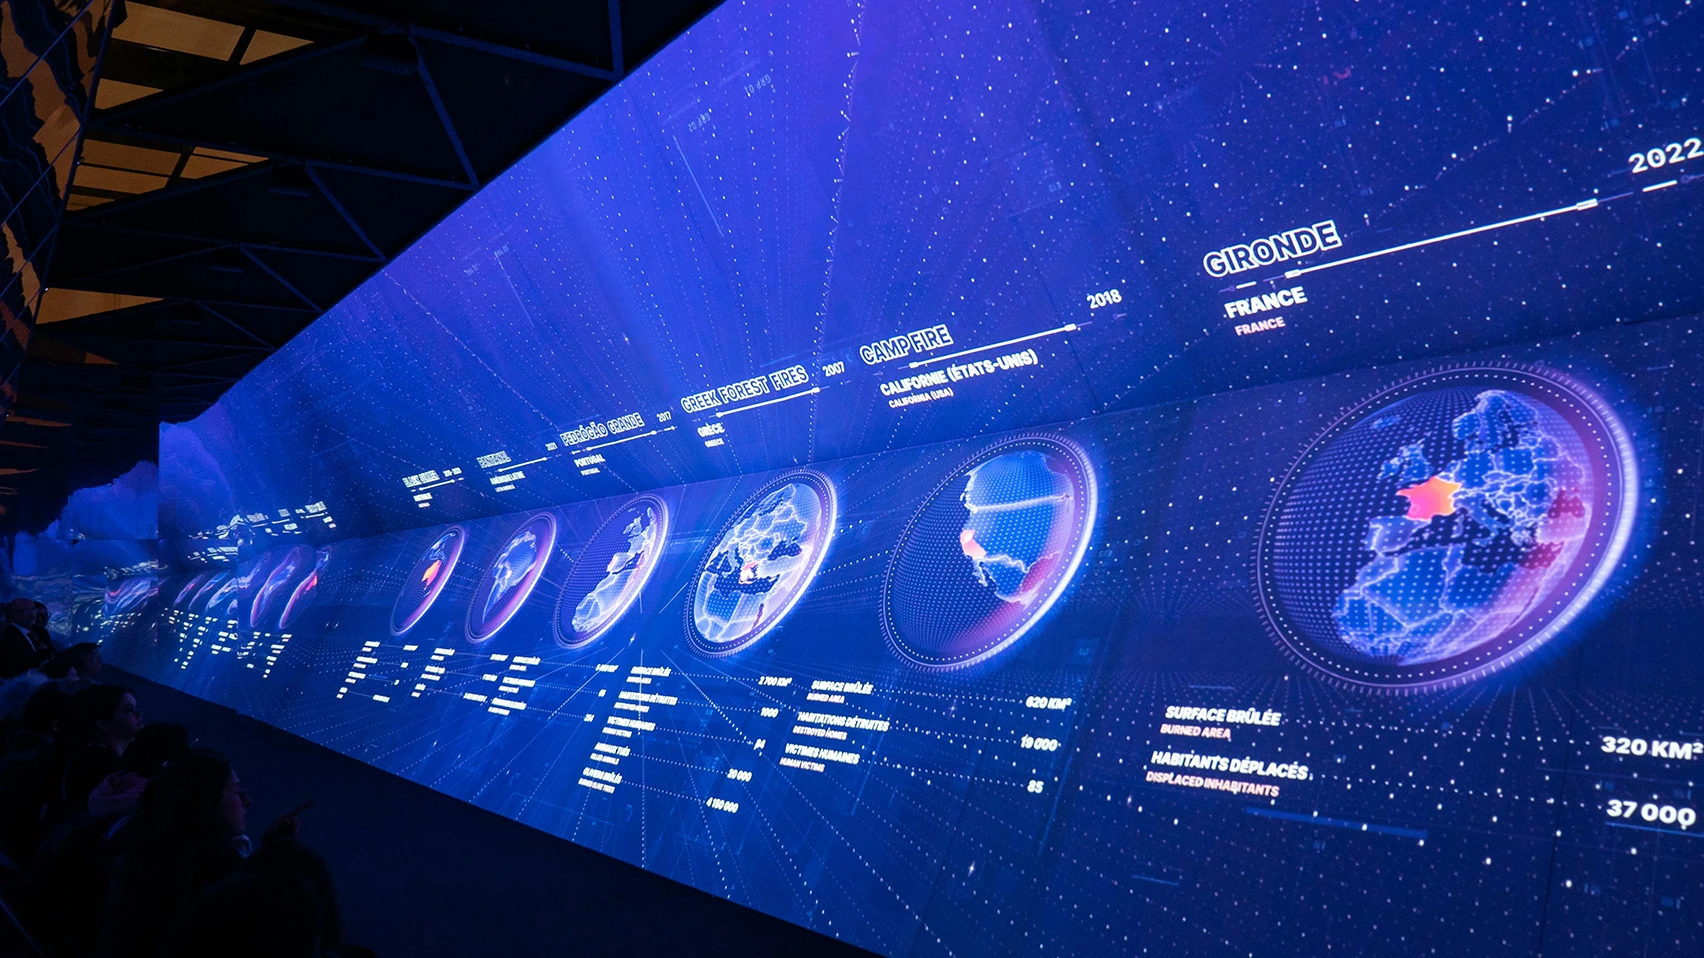
The data provided by Wedodata plays a key role in illustrating the impact and evolution of wildfires. I established the art direction for the data visualisations, defining their overall look and feel, graphic language and iconography. I developed a visual system that translated complex information into clear, engaging graphics, designed to integrate naturally within the exhibition.
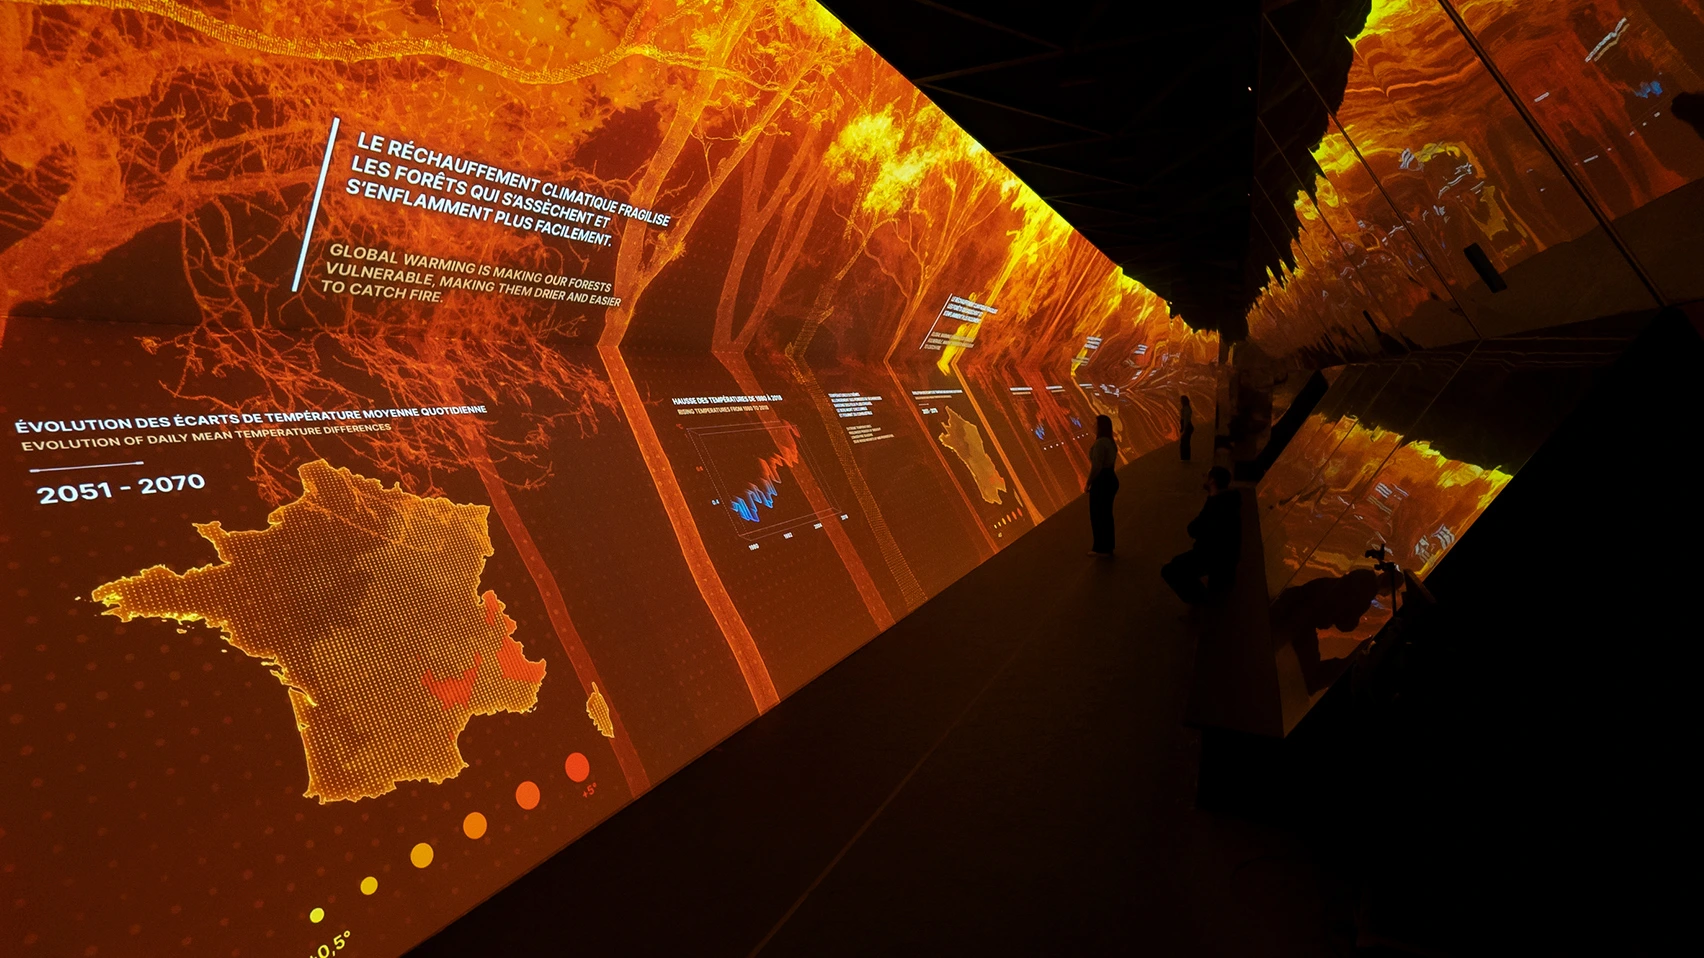
TYPOGRAPHY
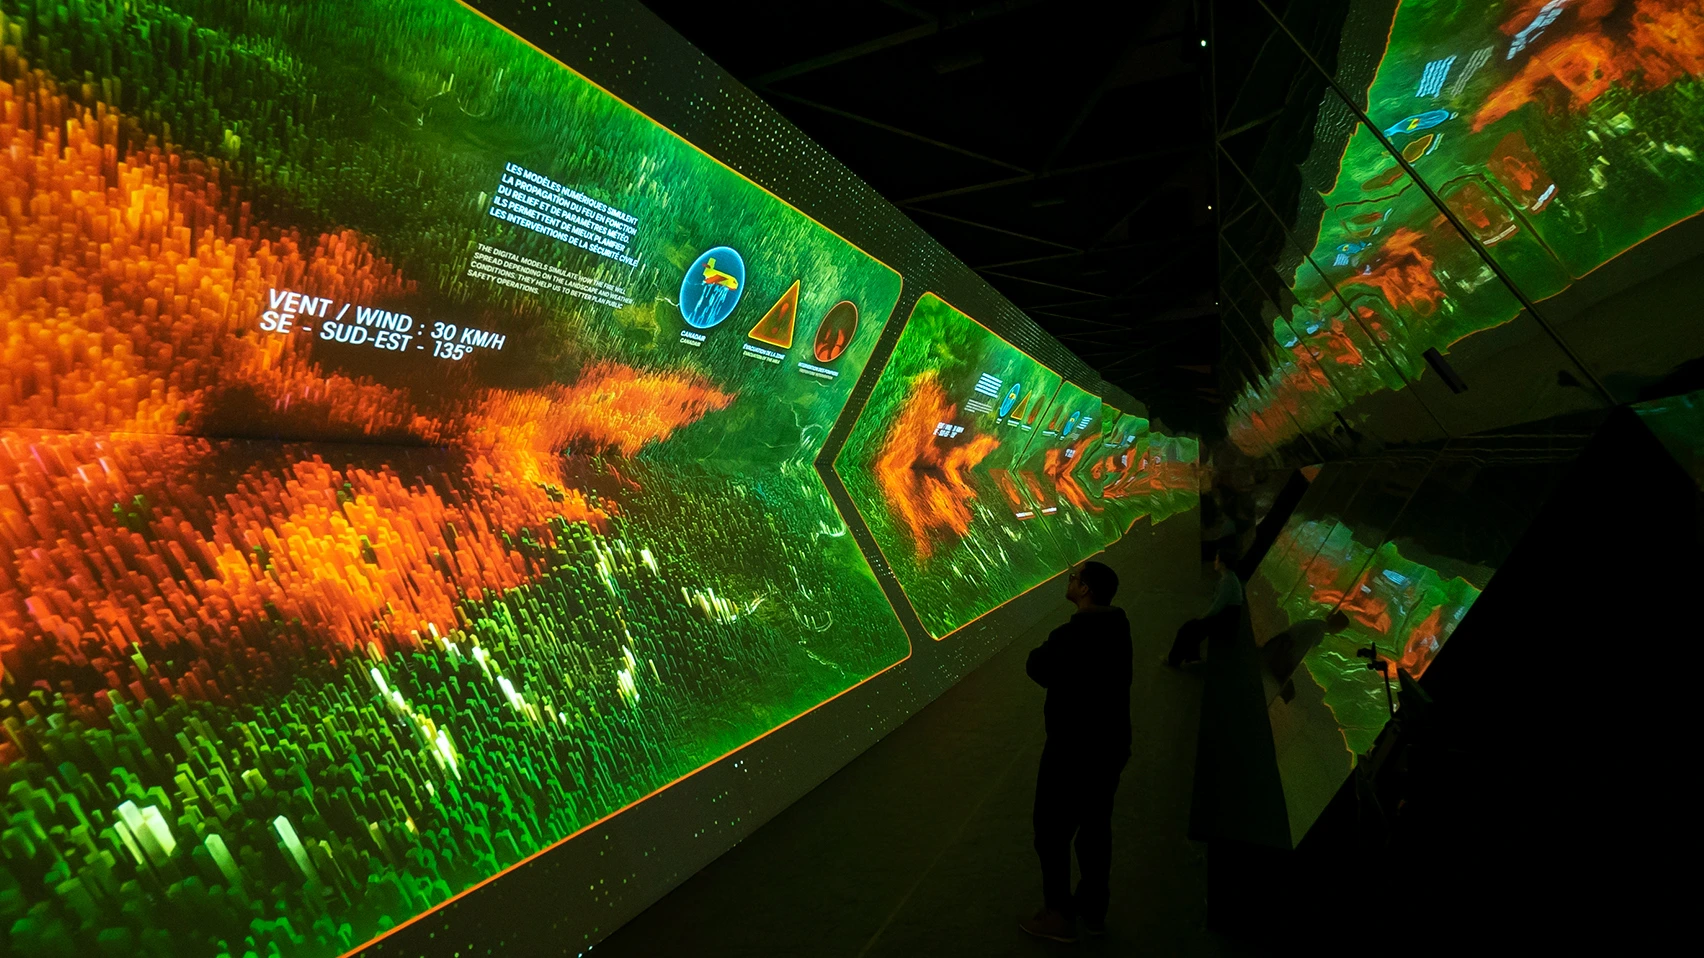
I curated the typography throughout the experience, selecting fonts that suited the visual direction and animating the text elements. Readability was a key consideration, so I carefully positioned the typography within the tunnel to ensure it remained clear from different viewpoints.
I also went on site to test the typography in the actual space and make adjustments to its scale, positioning and composition.
For the French and English versions, I used distinct colors to differentiate the languages while keeping the amount of text visually balanced within the space.
MAPS
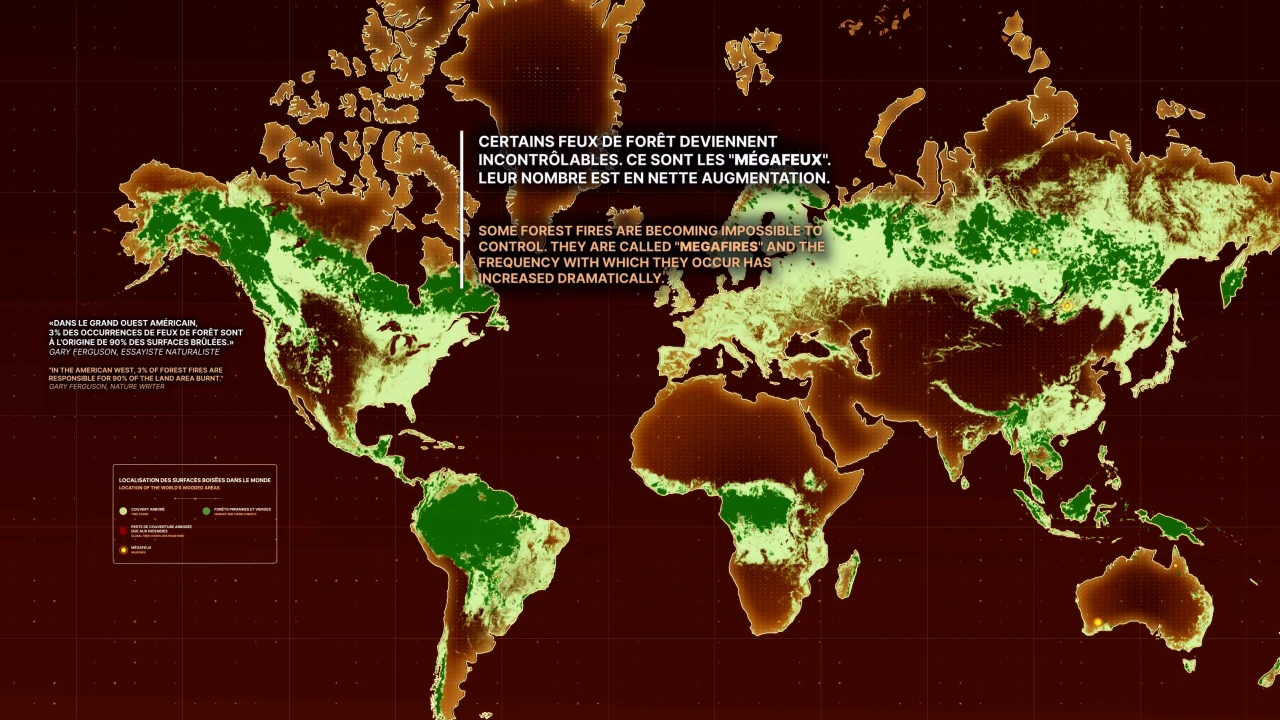
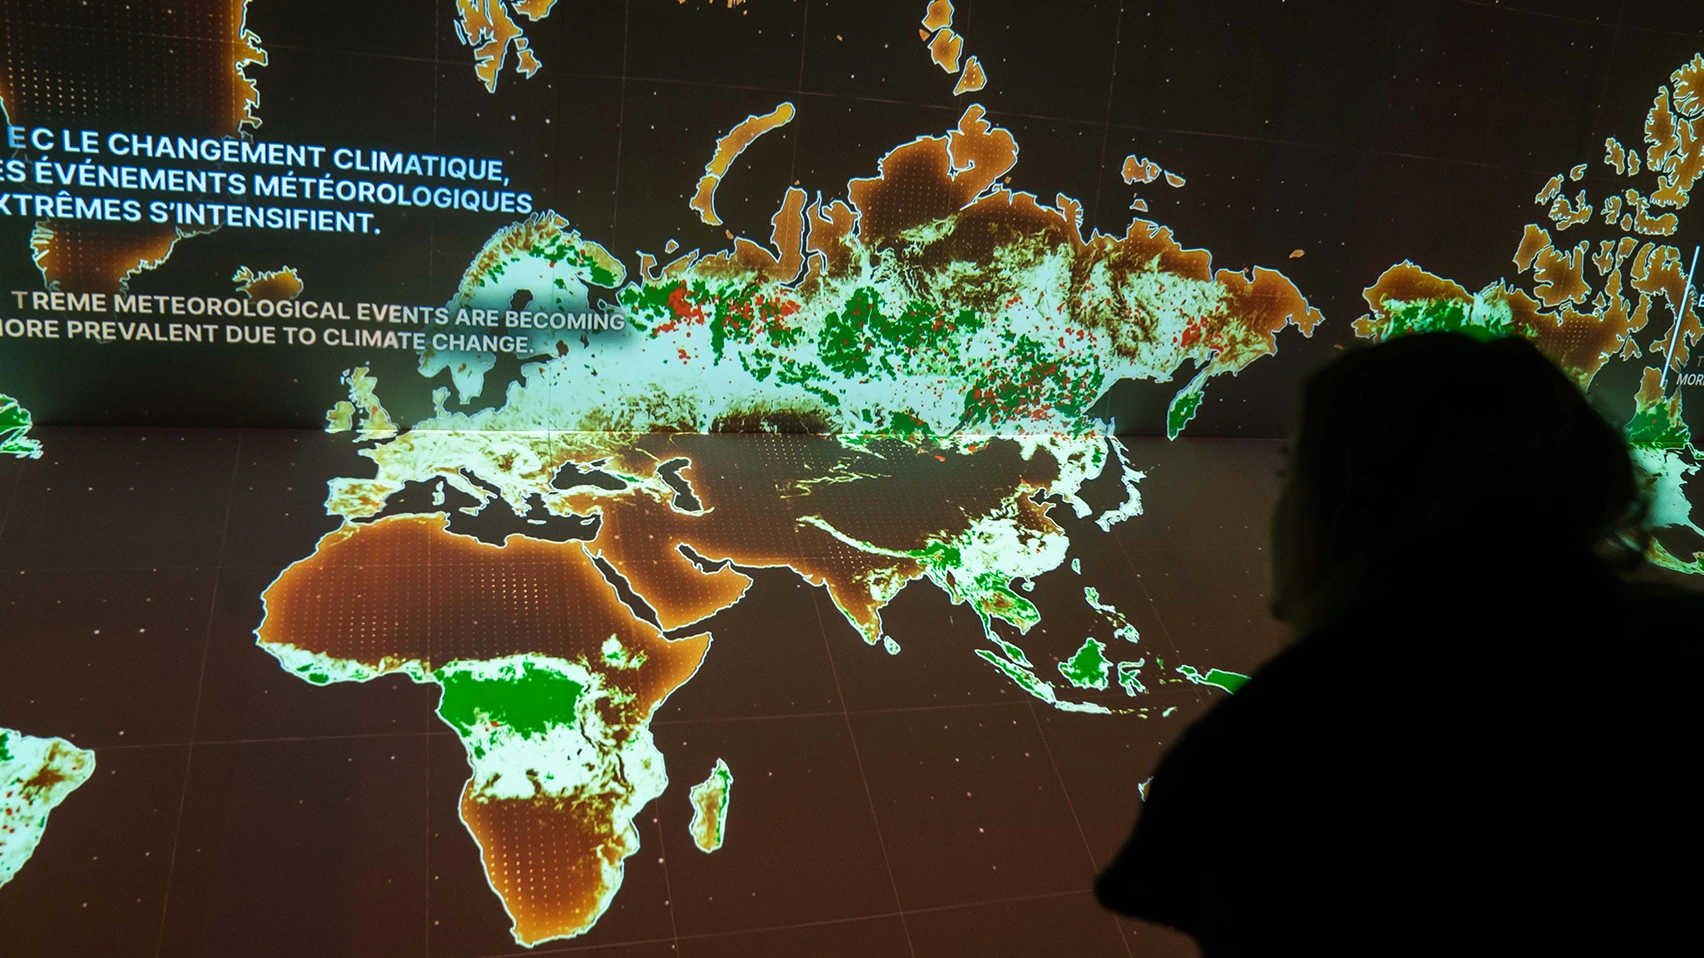
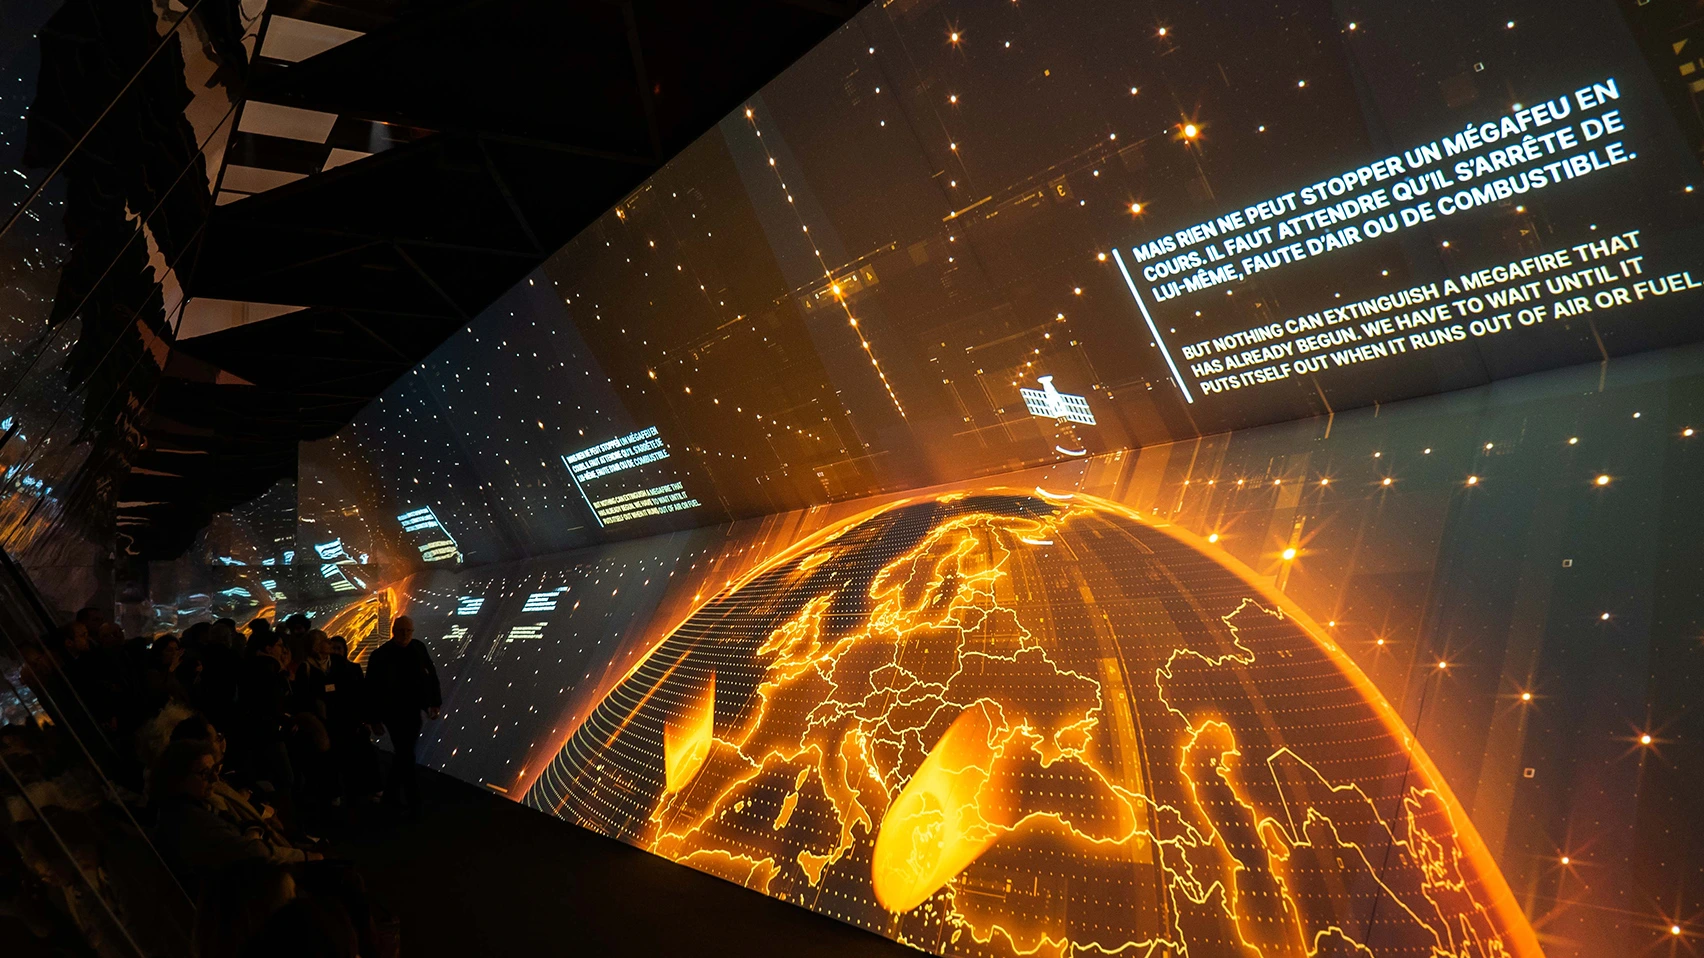
Several maps were used throughout the exhibition to explore different aspects of wildfires, from the location and evolution of megafires around the world to changes in vegetation and the spread of fire particles through the atmosphere.
I was responsible for the design and animation of the maps, working from the data provided by Wedodata and researching each topic to understand how the information could be translated visually. I developed the graphic treatment, visual hierarchy and animations to make the different datasets clear and engaging within the exhibition.